Pipeline Console
The Pipeline Console is a pre-built SAPUI5 freestyle app (flexible column layout) for inspecting and operating pipelines at runtime. It reads and writes the management OData API at /pipeline/ — list pipelines, inspect source and target data, review run history, trigger runs, and manage in-process schedules.
The console's pre-built application assets ship inside the cds-data-pipeline npm package at app/pipeline-console/. SAPUI5 loads from the pinned 1.150.0 runtime on ui5.sap.com by default; the framework itself is not duplicated in the package. Deployments that cannot reach that CDN can point the console at a self-hosted runtime with management.ui5Url.
What you get
| Surface | Path | Notes |
|---|---|---|
| Pipeline Console (this page) | /pipeline-console/ | Freestyle FCL — list / detail / data inspector. Shipped with the plugin. |
| Management OData API | /pipeline/ | Opt in via management.reuse.api or manual CDS import. See Management service. |
The console manifest binds its default OData model to /pipeline/ (absolute URL). UI and API share the same CAP origin — no CORS or reverse-proxy path rewriting when both run on the same server.
Layout
| Column | Content |
|---|---|
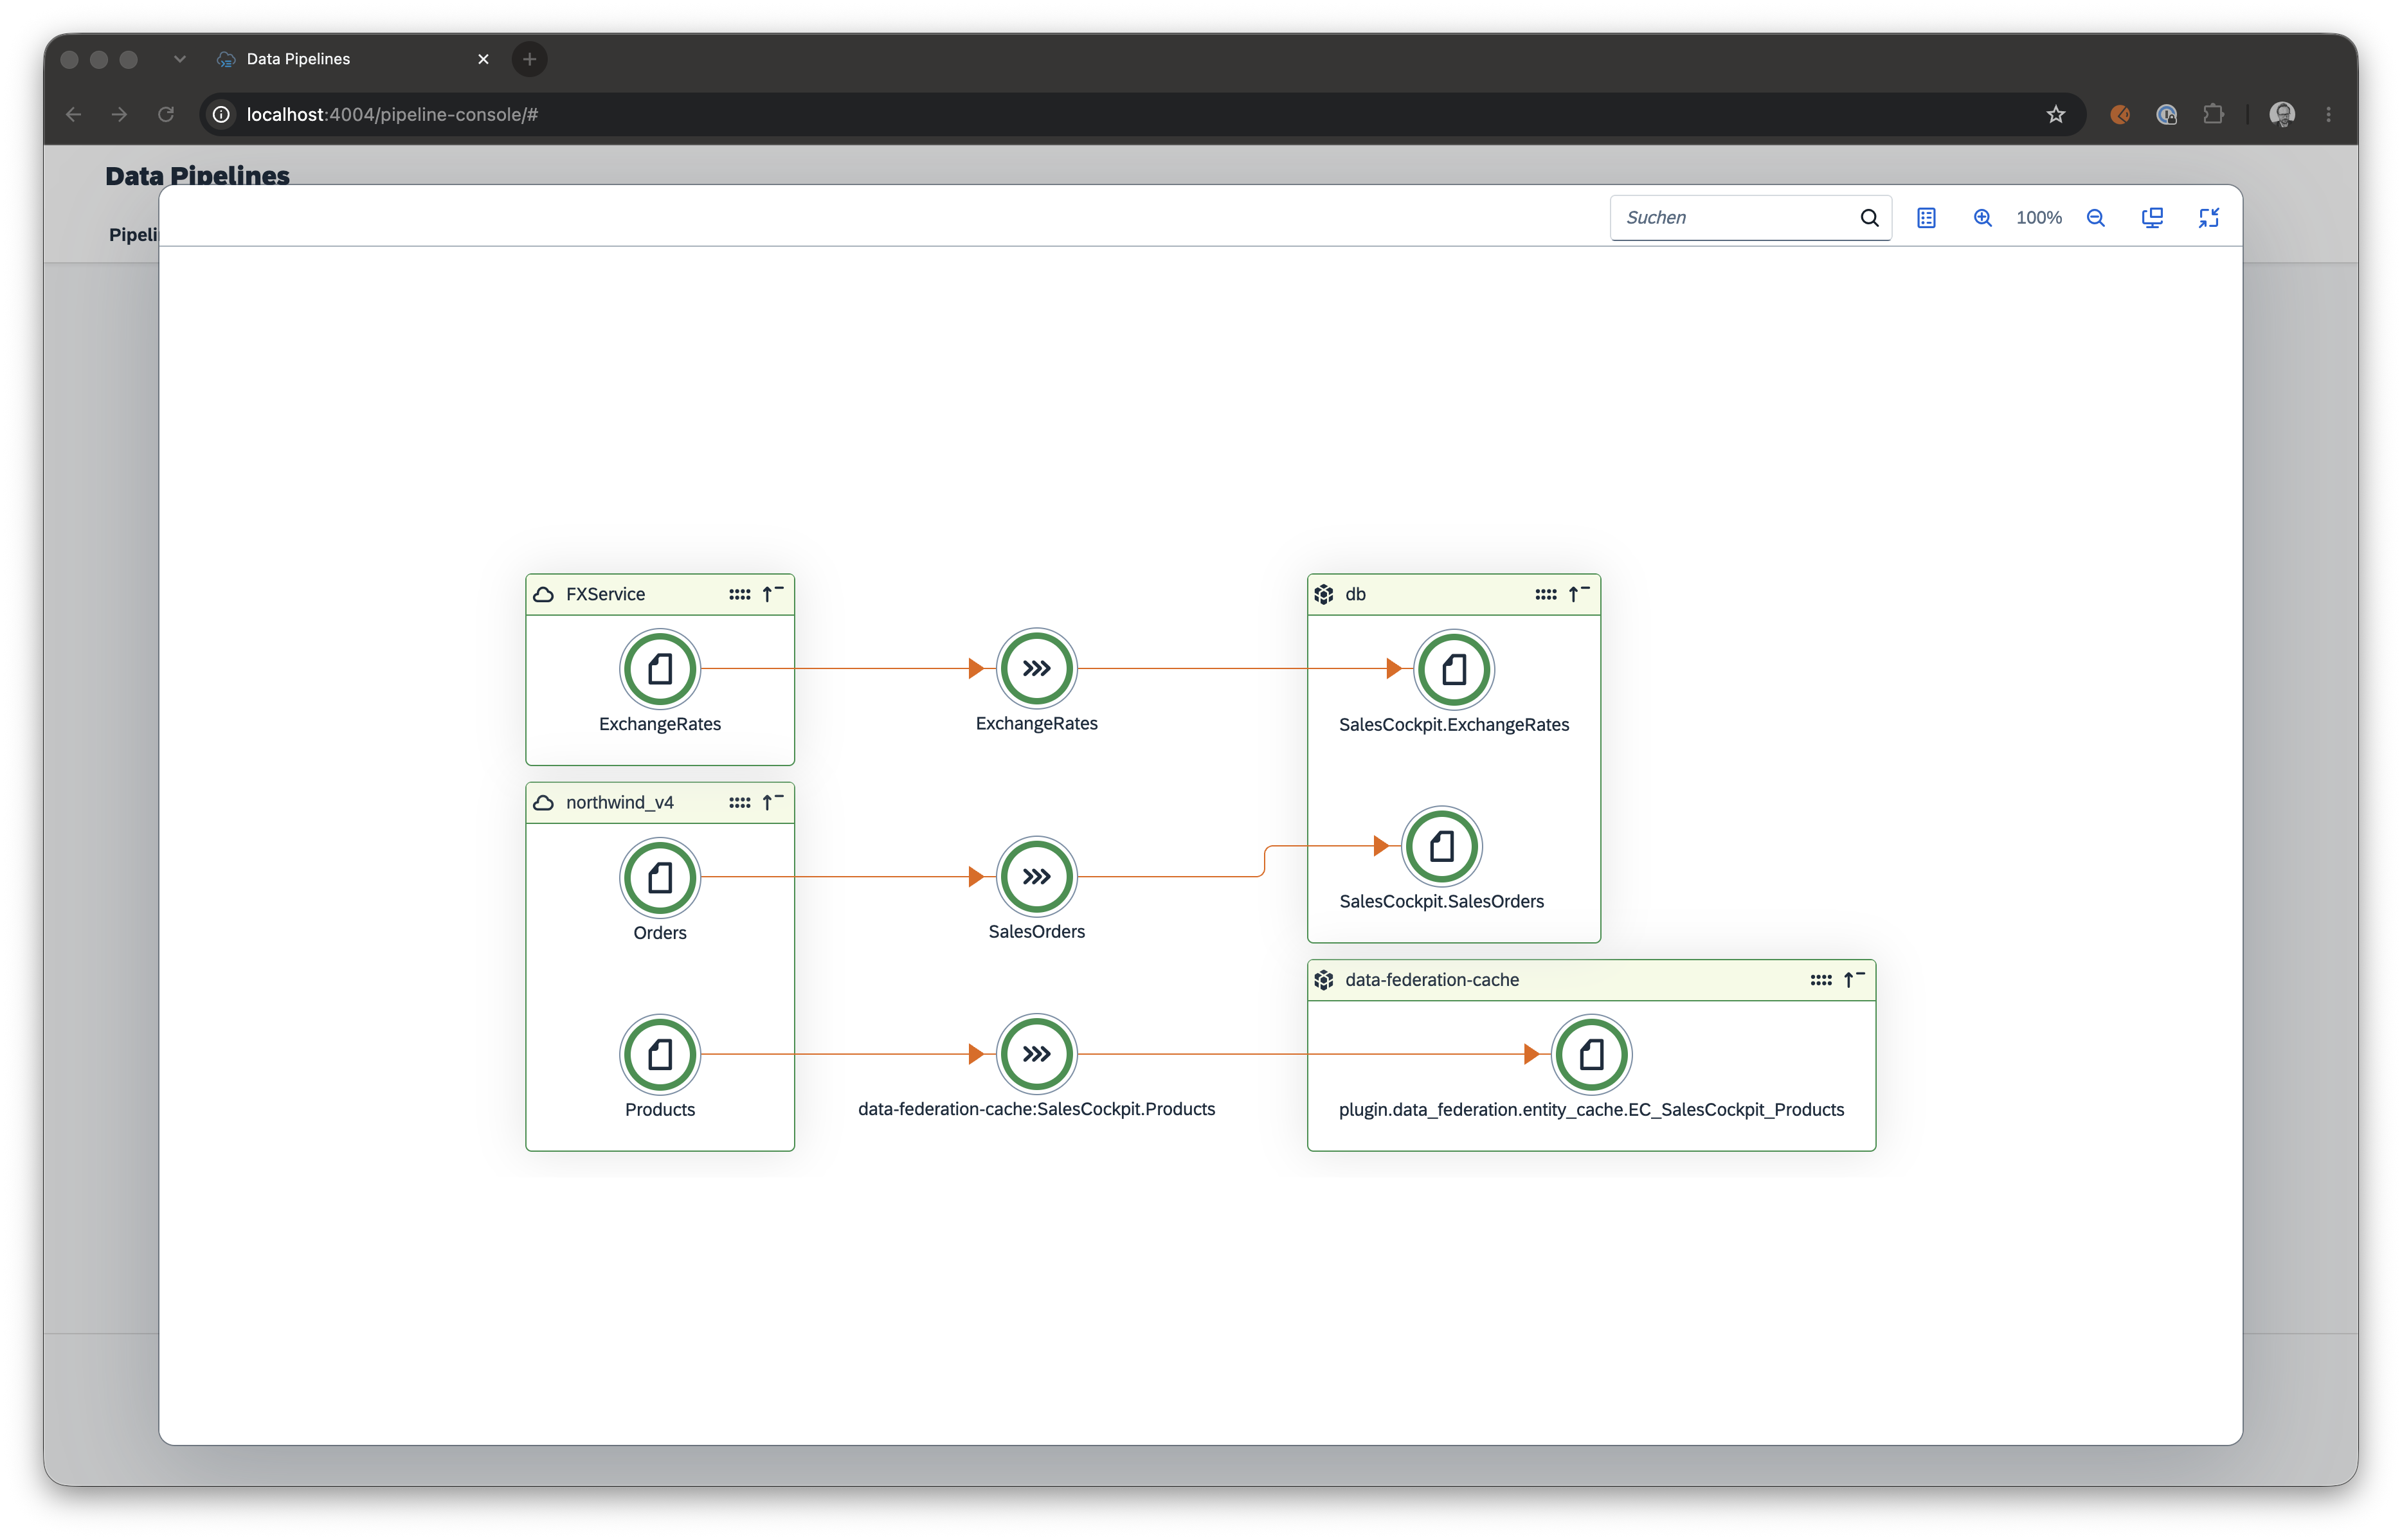
| Begin — Data Pipelines | Pipelines tab: searchable list with status summary, last-run column, error counts, and manual refresh. Overview tab: landscape network graph grouped by service (entity / consumption-view nodes inside each group) |
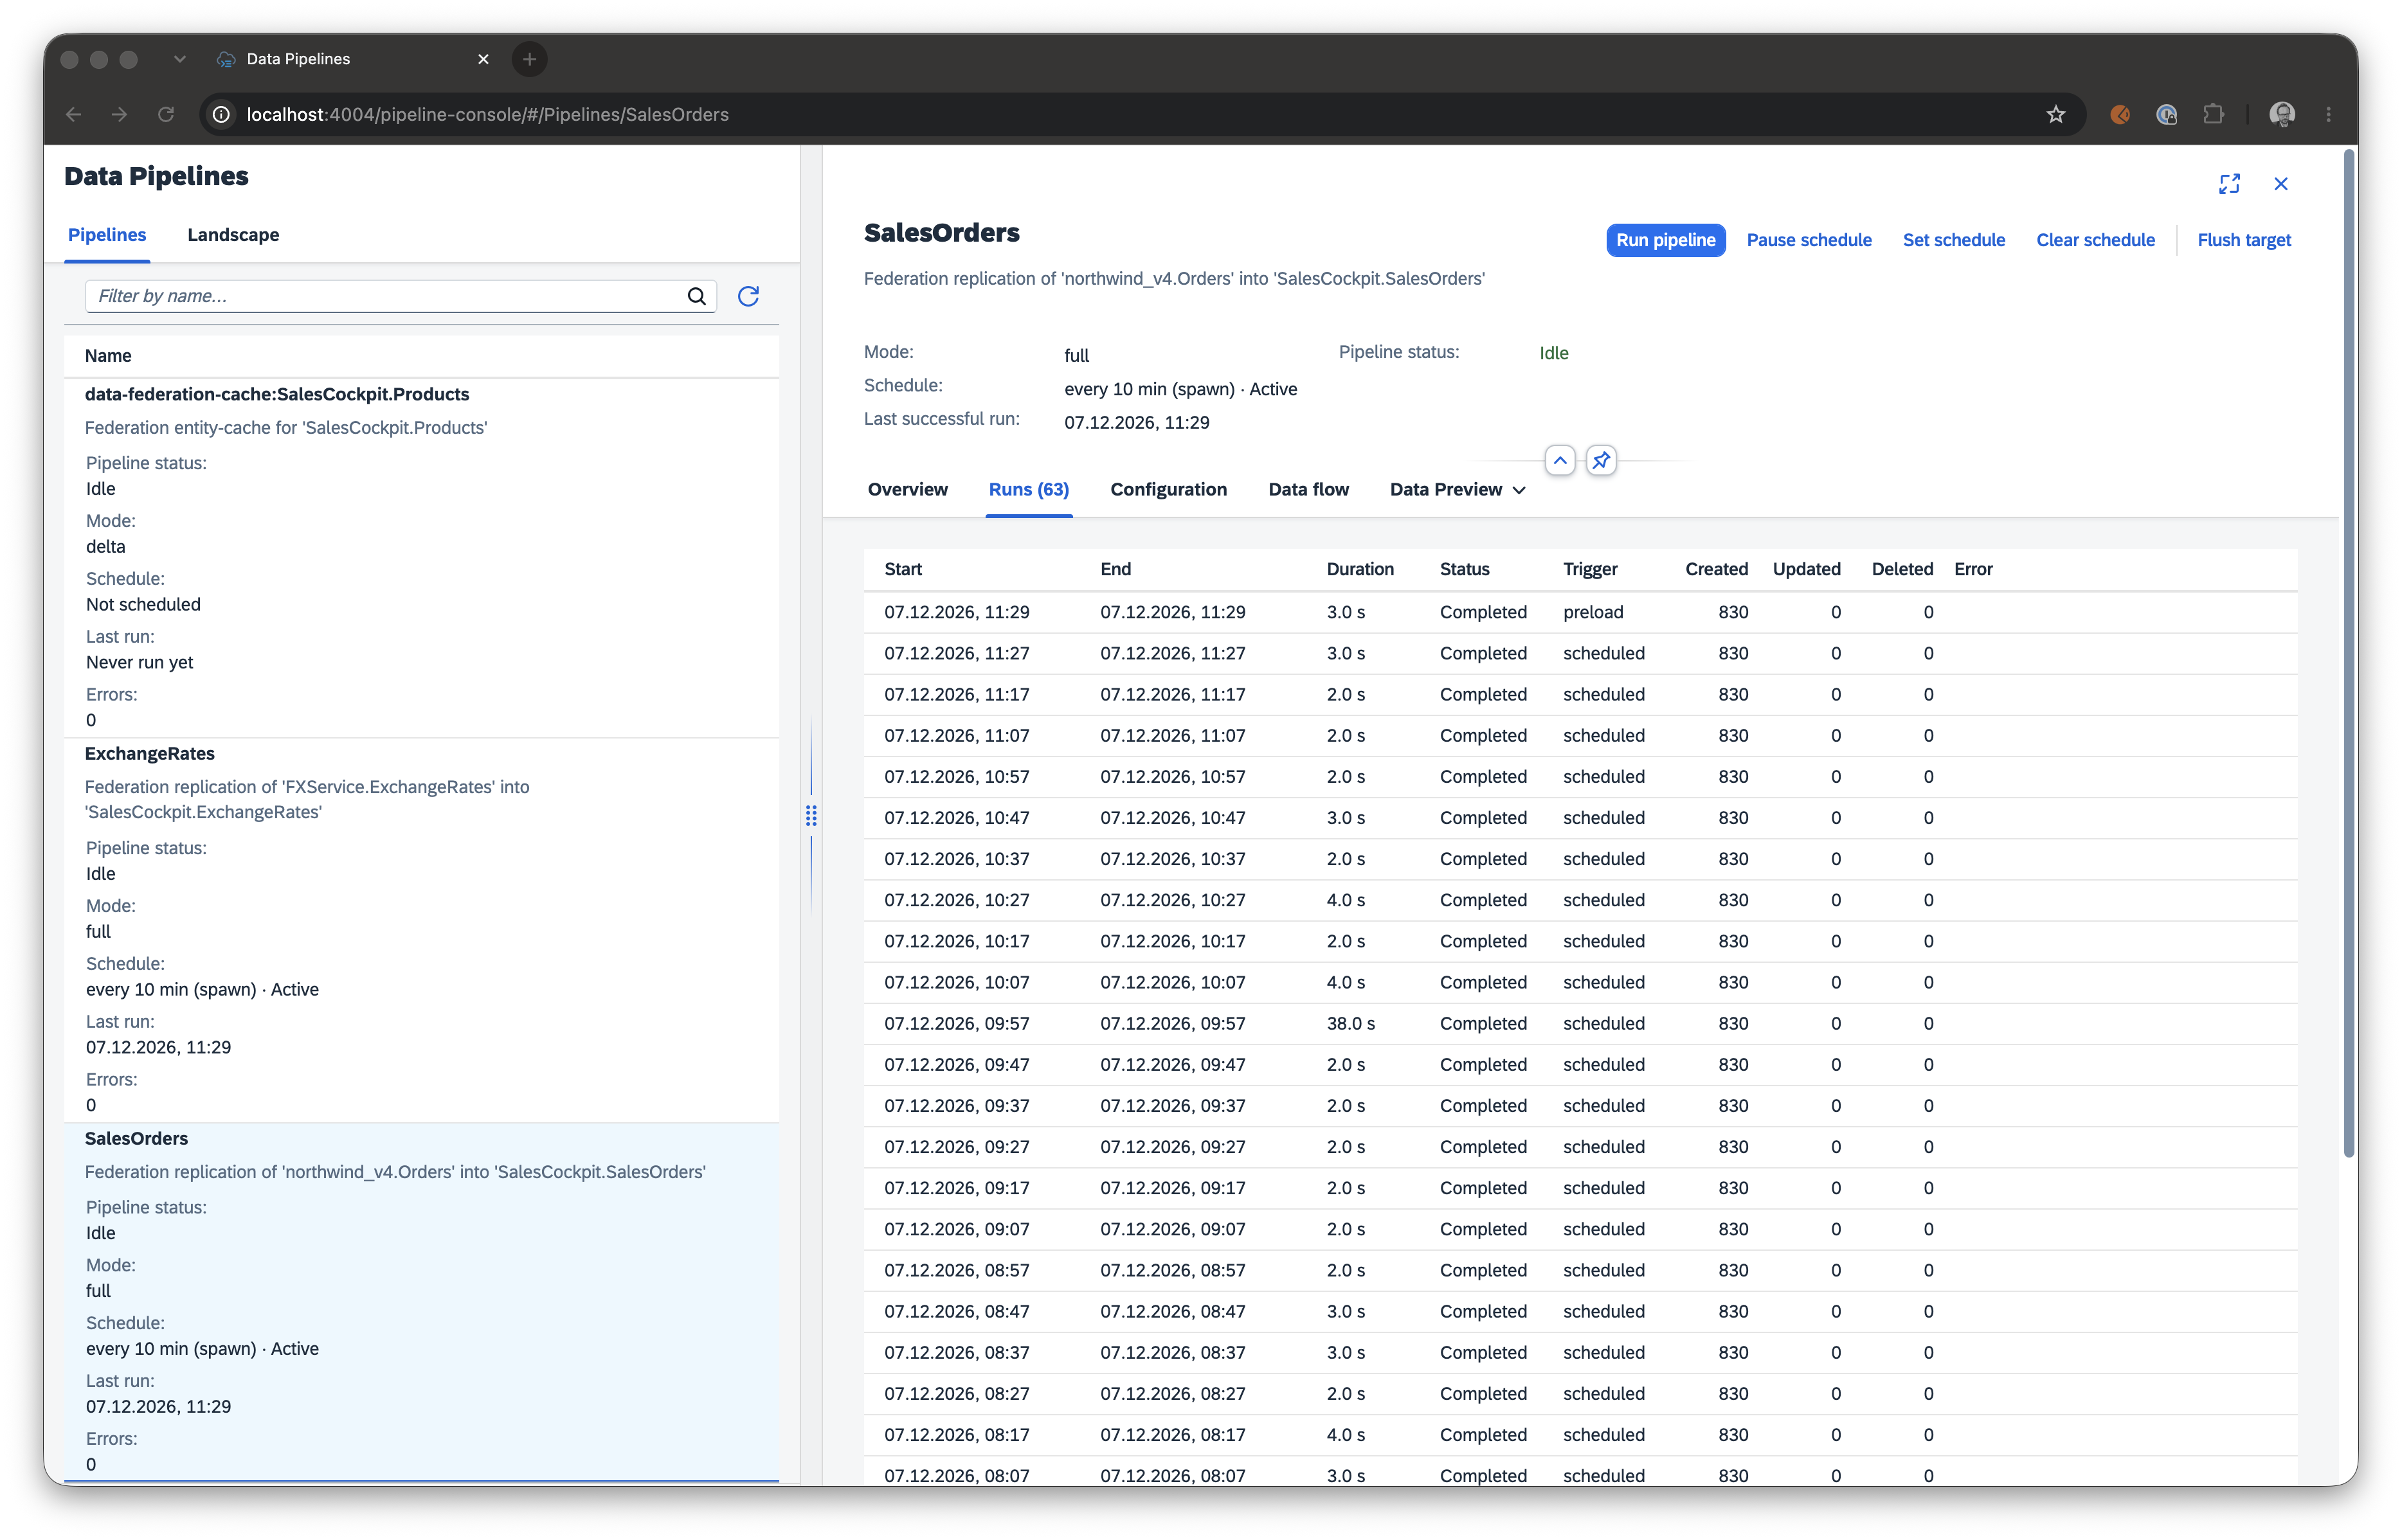
| Mid — Pipeline detail | Overview (status, health counters, cumulative statistics, raw JSON); Runs; Configuration (coded / override / effective); Data flow graph; Data Preview. Orange marks custom hooks or non-default configuration |
| End — Data inspector | Source/target toggle, column selection, advanced filters, and paged preview table via inspectData |
Screenshots
Landscape — pipelines grouped by remote service; entity nodes and flow arrows show source → pipeline → target:
Pipelines list and run history — schedules, status, and per-run statistics (including federation-bound replicate jobs):
Status semantics
Pipeline status (idle / running / failed) reflects the tracker lifecycle — whether a run is in progress and whether the last run failed — not data freshness. Last successful run (lastSync) is written only after a completed successful run; until then the UI shows Never run yet. Enabled / Paused gates scheduled ticks only — manual Run pipeline still works while paused.
The console polls every 30 seconds when idle and every 3 seconds while any pipeline is running, refreshing the pipeline list and the Overview and detail data-flow graphs.
Console capabilities
Actions call the same bound and unbound operations documented in Management service: start, setSchedule, clearSchedule, setOverrides, clearOverrides, setEnabled, configView, flush, inspectData, flowMetadata, and landscapeMetadata. Configuration layering is described in Configuration overrides.
Quick start — local reuse (recommended)
Add to your project's package.json:
{
  "cds": {
    "requires": {
      "data-pipeline": {
        "impl": "cds-data-pipeline",
        "management": {
          "reuse": {
            "api": true,
            "console": true
          }
        }
      }
    }
  }
}Then:
cds deploy
cds watchOpen http://localhost:4004/pipeline-console/index.html (port from your profile).
No server.js changes, no local UI copy. See Feature activation for reuse vs own decision rules.
For an air-gapped deployment or a content-security policy that only permits same-origin scripts, configure an HTTP(S) URL or absolute path:
"management": {
  "reuse": { "api": true, "console": true },
  "ui5Url": "/ui5/1.150.0/resources/sap-ui-core.js"
}Keep a custom runtime compatible with the minUI5Version in the console manifest.
Developing the UI (TypeScript)
Edit sources under packages/cds-data-pipeline/app/pipeline-console-src/webapp/ only. The dev server transpiles TypeScript on save and proxies requests under /pipeline to the contributor dev backend on port 4100.
# Terminal 1 — dev backend (four pipelines)
bash packages/cds-data-pipeline/examples/_dev/pipeline-console/start.sh
# or: cd packages/cds-data-pipeline && npm run dev:console-backend

# Terminal 2 — live TypeScript UI
cd packages/cds-data-pipeline && npm run dev:pipeline-consoleOpen http://localhost:8090/index.html. Pipeline details: examples/_dev/pipeline-console/README.md.
| Script | Purpose |
|---|---|
dev:console-backend | Start dev backend on :4100 |
dev:pipeline-console | Live TS UI on :8090 (proxies to :4100) |
build:pipeline-console | Production bundle into app/pipeline-console/ |
Feature examples (01–07) use the built console at /pipeline-console/ — not this dev flow.
BTP production — project-owned UI
For HTML5 Application Repository + approuter deployments:
"data-pipeline": {
  "impl": "cds-data-pipeline",
  "management": { "reuse": { "api": true } }
}cds add pipeline-console
cds add html5-repo
cds add mta
cd app/pipeline-console && npm install && npm run build:cfUse --source on cds add pipeline-console to copy TypeScript sources from app/pipeline-console-src/ instead of the pre-built bundle when you need to customize the UI.
Do not set management.reuse.console when you already ran cds add pipeline-console.
Manual management API import
When you prefer explicit CDS control over management.reuse.api:
using from 'cds-data-pipeline/index.cds';Mount the console with cds add pipeline-console (BTP) or management.reuse.console (local reuse).
Composite / mashup apps
Pipeline services are embedded when your CDS model reaches the plugin definitions. With management.reuse.console, the plugin mounts static UI assets at /pipeline-console/ during bootstrap. Dynamic requests still hit /pipeline/ on the same process.
Security
The plugin does not attach @(requires: …) to the management service. Secure /pipeline in your CDS model and deployment (XSUAA, approuter, annotations). The console uses the same OData session as the rest of your app. inspectData exposes live source and target rows — treat it with the same authorization as the underlying entities.
Production hardening built into the pipeline inspector:
| Control | Behavior |
|---|---|
| Opt-out | Set management.inspect: false on your cds-data-pipeline requires entry to disable inspectData and hide inspector tabs (inspectCapabilities returns none for both sides). |
| Field / entity exclusion | Honors @HideFromDataInspector on modeled source/target entities — hidden elements are never selected; entity-hidden sides report none and return no rows. |
| Audit logging | When @cap-js/audit-logging is installed (cds.requires['audit-log']), preview reads emit SensitiveDataRead for columns annotated with @PersonalData.IsPotentiallySensitive (best-effort; failures are logged, never block the preview). |
For app-wide entity browsing, search, and Work Zone tiles with full compliance wiring, use @cap-js/data-inspector in your project. The pipeline inspector remains the right tool for pipeline-scoped previews (remote OData/REST sources, secondary DB targets, custom adapters) that the cap-js plugin cannot see.
See Securing /pipeline.
Without a UI
The management API is fully usable without any UI:
GET /pipeline/Pipelines
GET /pipeline/PipelineRuns
POST /pipeline/execute
GET /pipeline/Pipelines('MyPipeline')/DataPipelineManagementService.inspectData(side='target',top=50,skip=0)See Management service for the full surface.
See also
- Feature activation — decision tree, reuse vs own, duplicate-loading rules
- Get started — end-to-end walkthrough
- Programmatic API —
inspectData,getFlowMetadata, and the methods the console calls - Management service — OData entities, actions, hooks
- Feature catalog — observability and UI capabilities